Track El Niño like an expert.
The daily Niño 3.4 index, the ocean below the surface, Kelvin waves, and 13 forecast models, plus a seasonal outlook for your own area. The data NOAA uses, in your pocket.
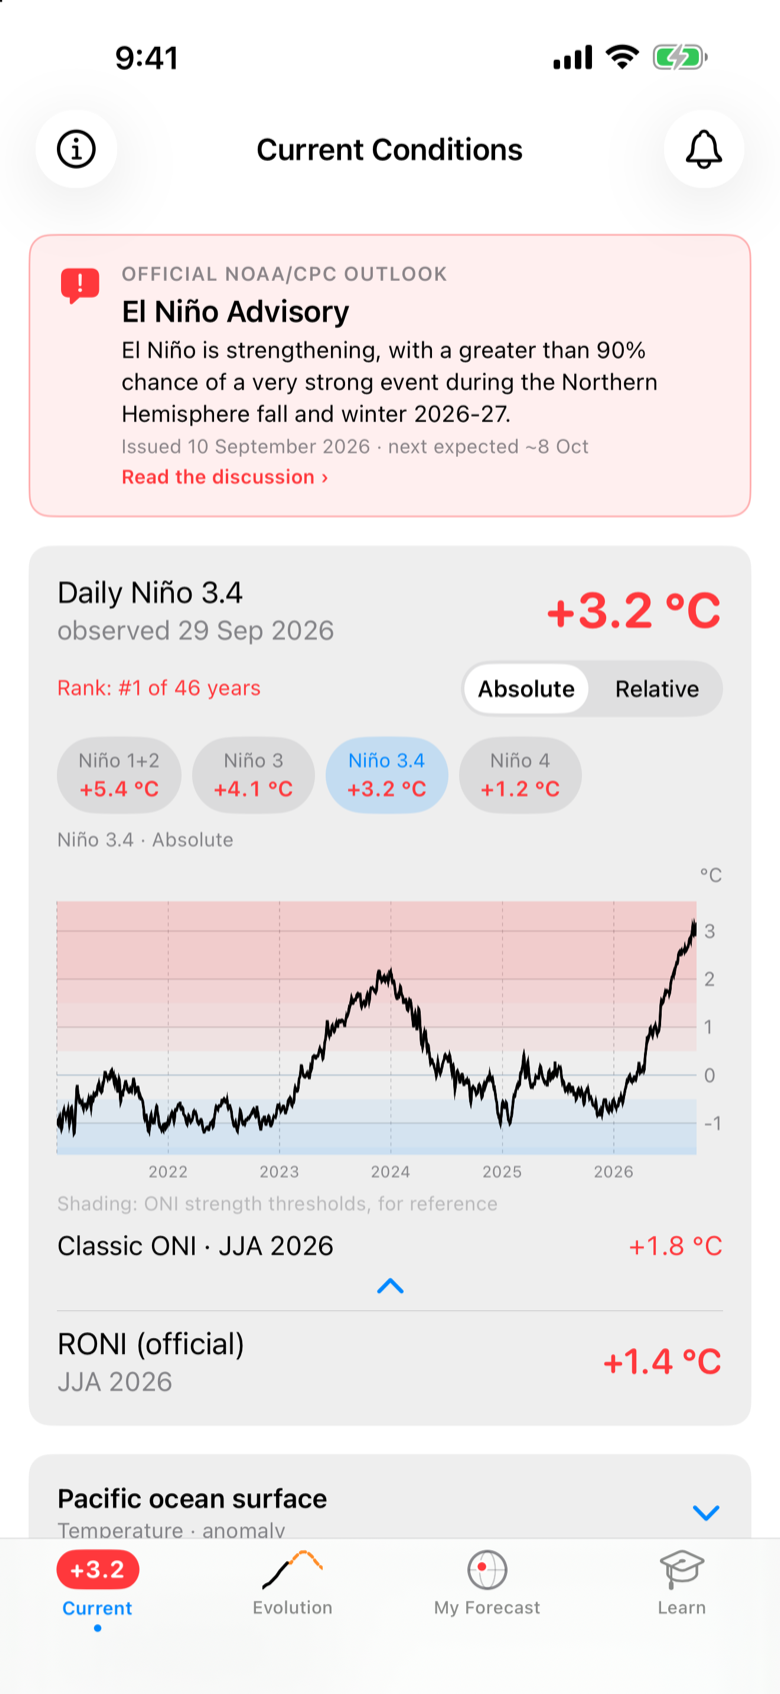
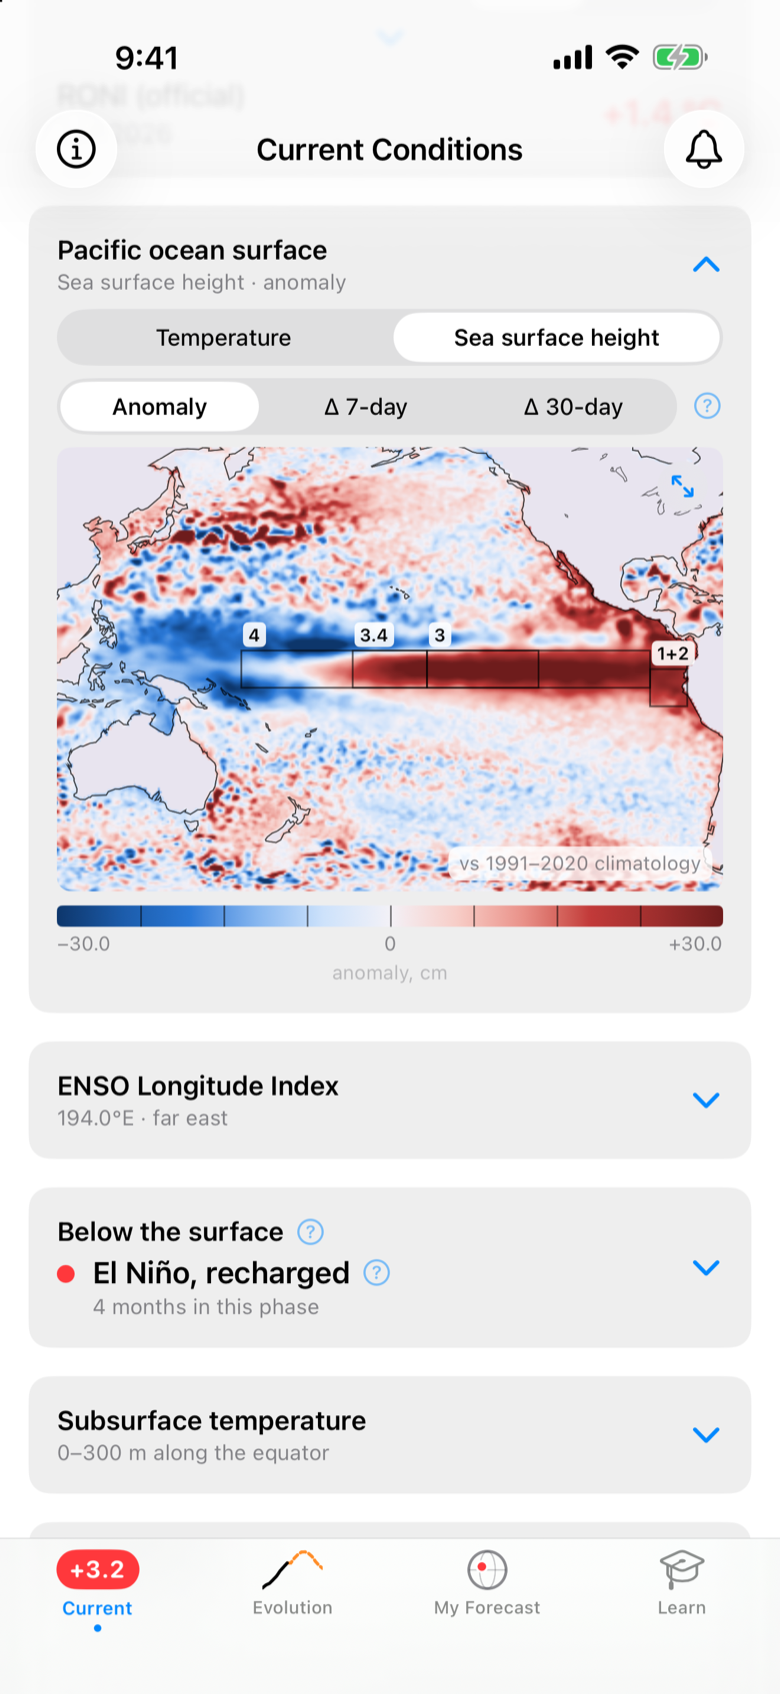
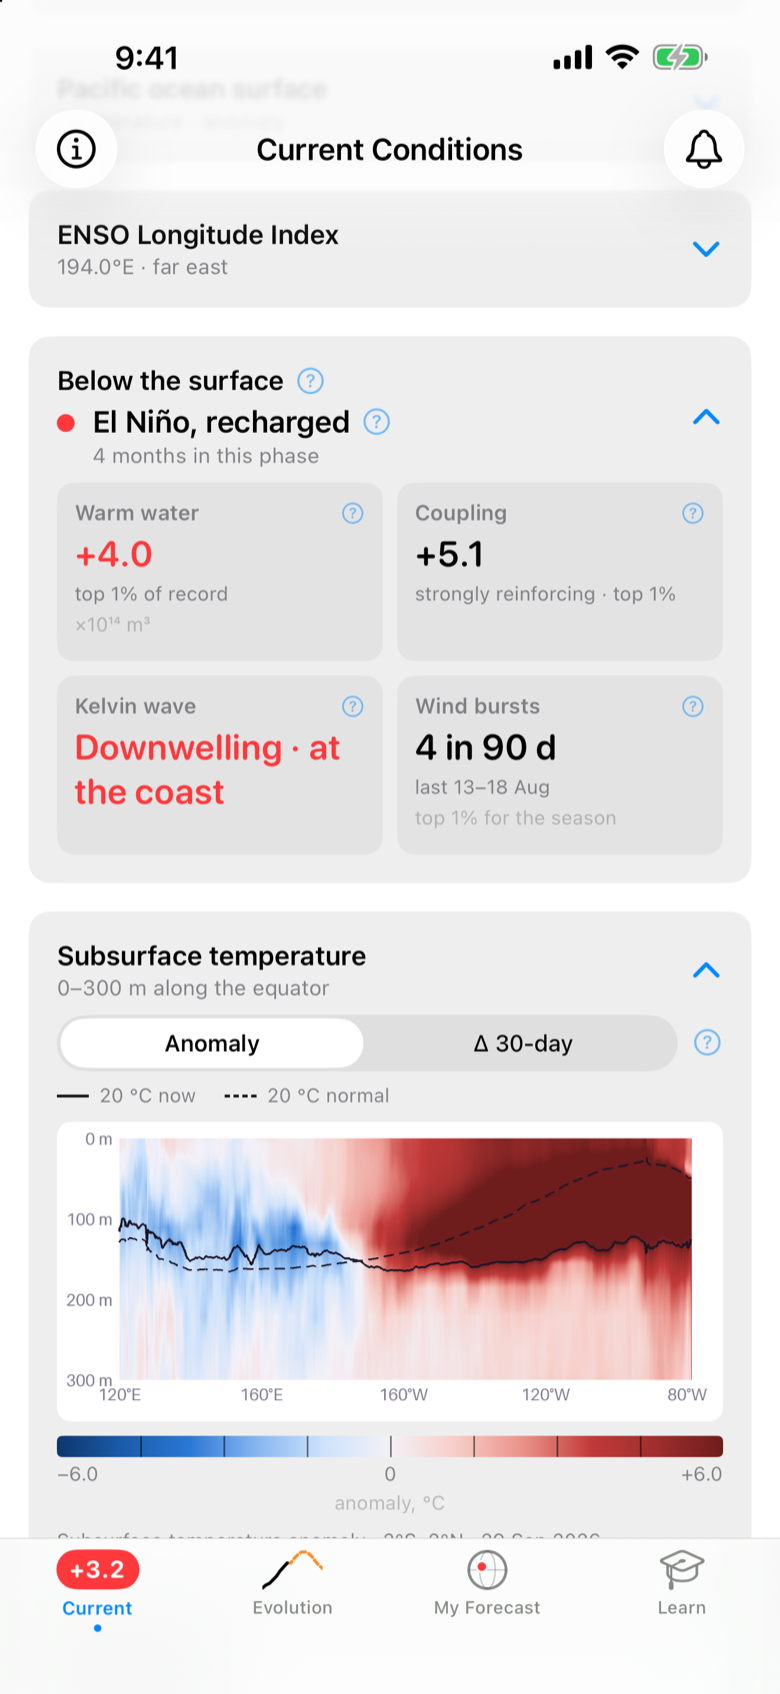
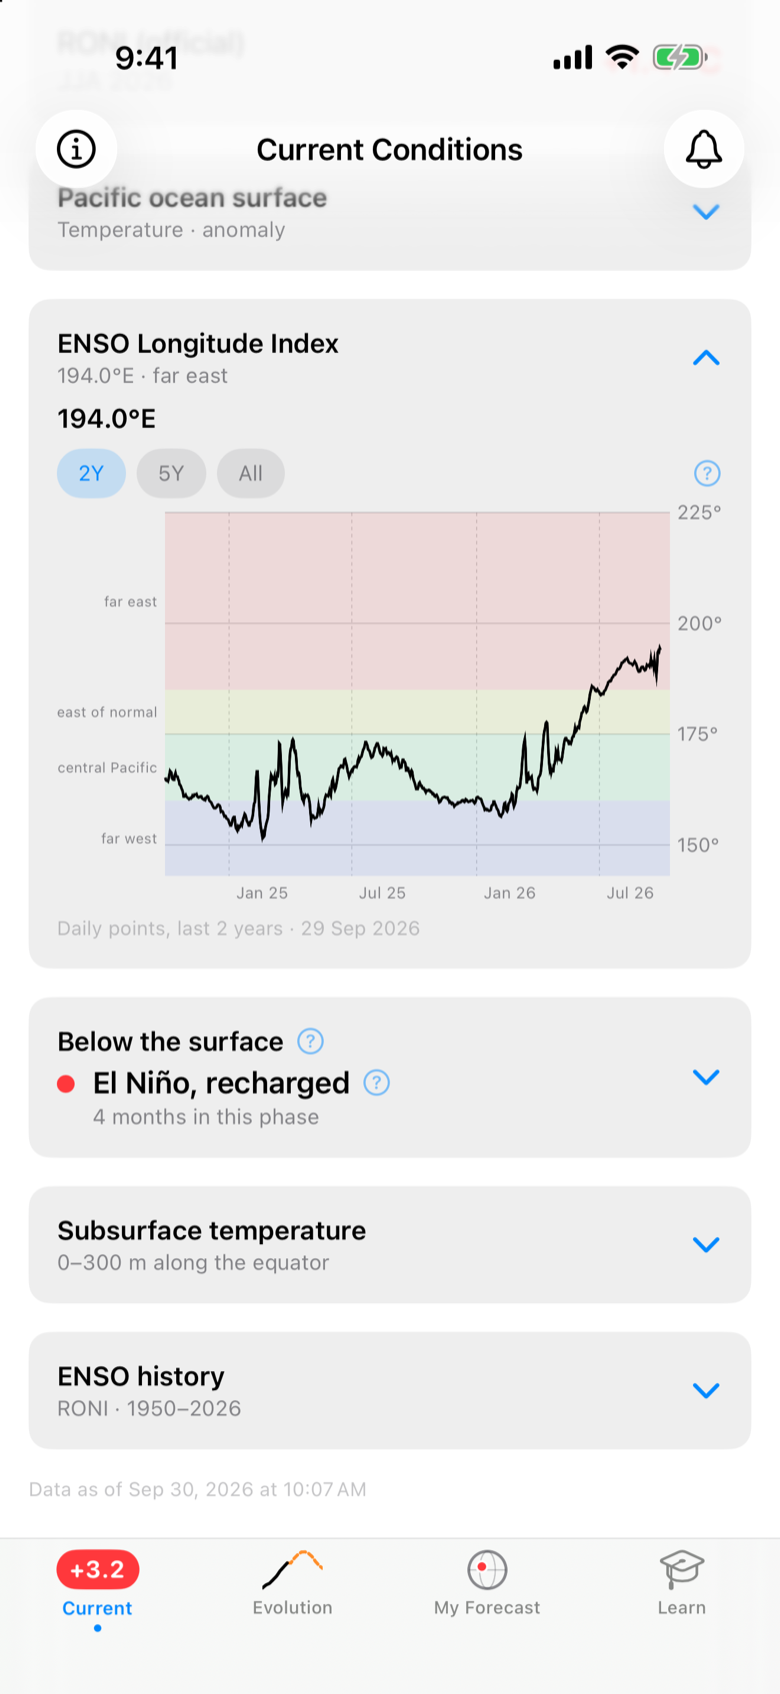
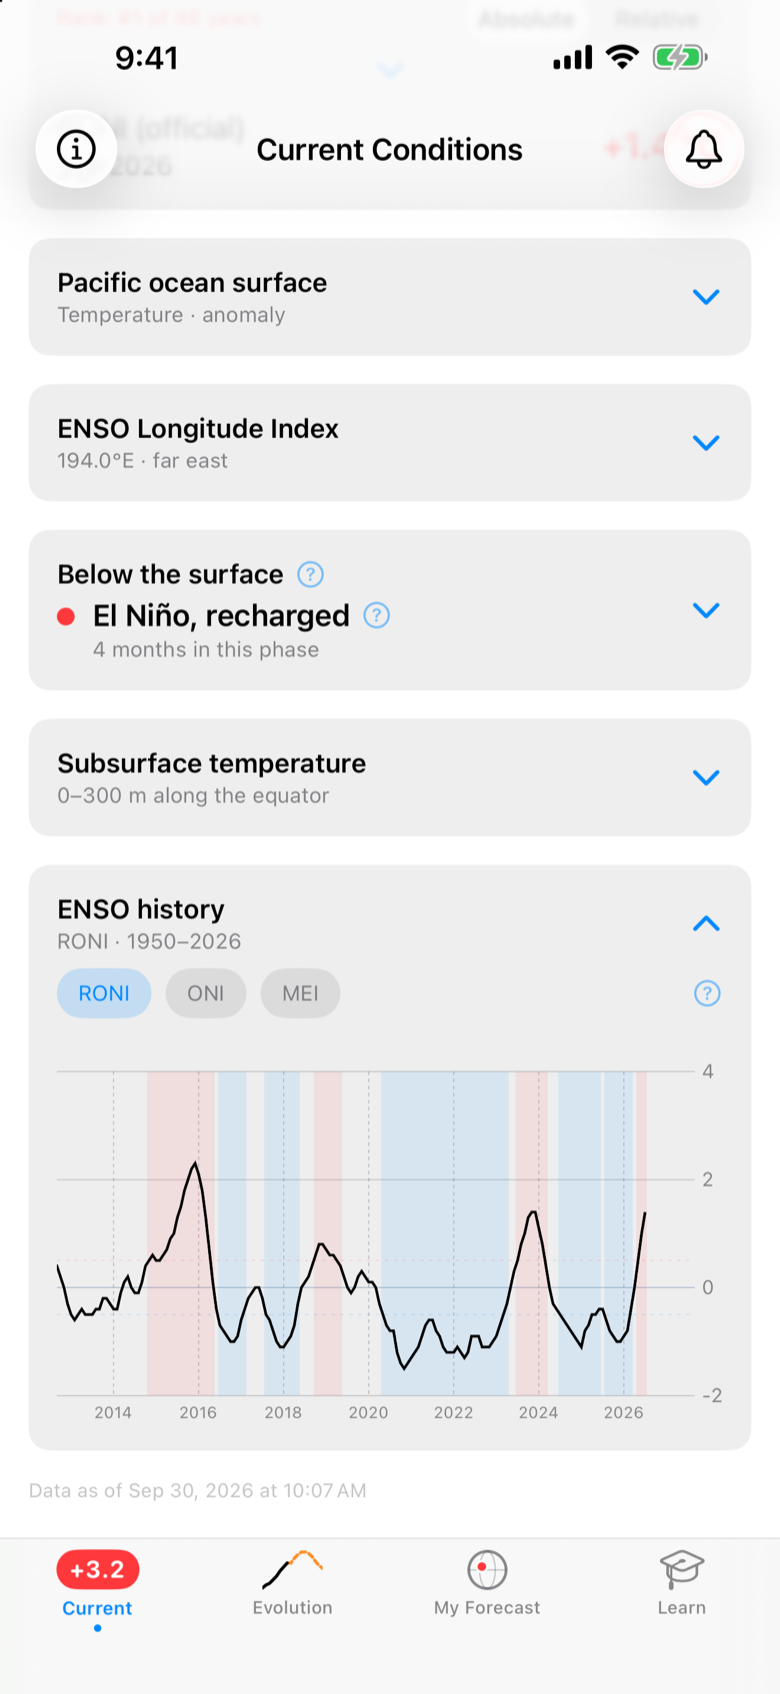
Real screens rendered from live data — scroll →
iPhone · requires iOS 17 or later · one-time purchase, no subscription
A very strong El Niño is building for winter 2026–27. Version 1.1 follows it from the surface to 300 m down.
Current conditions
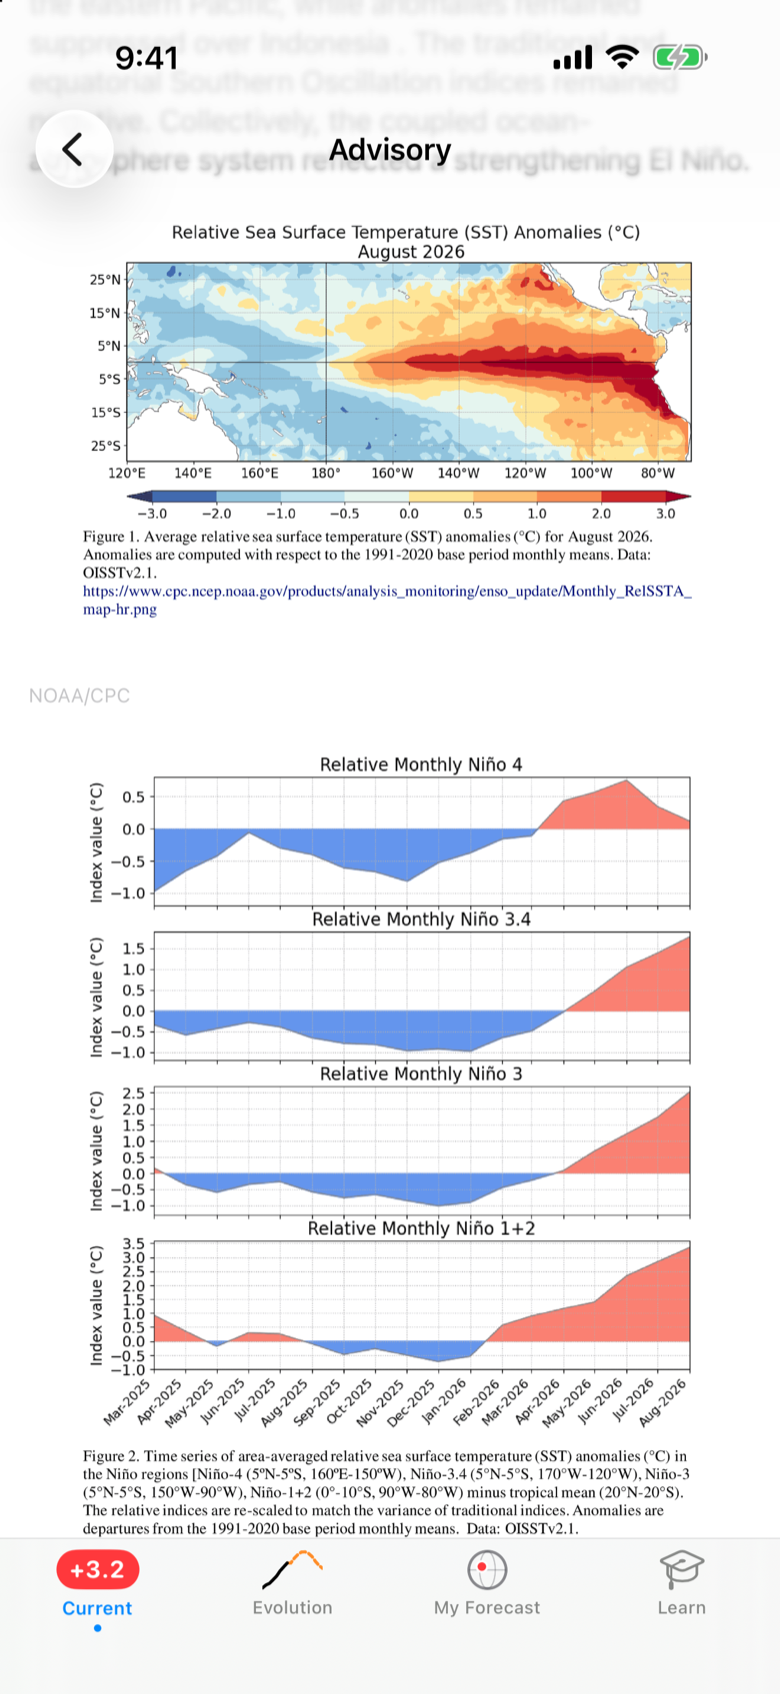
The daily Niño 3.4 index, absolute or relative to the warming tropics, with its record rank; RONI, NOAA's official index since 2026; and the full NOAA/CPC advisory with its figures.
Below the surface New
The ENSO phase, warm water volume, ocean–atmosphere coupling, westerly wind bursts, and a Kelvin wave tracker that follows waves across the Pacific and up and down the American coasts.
Expert views New
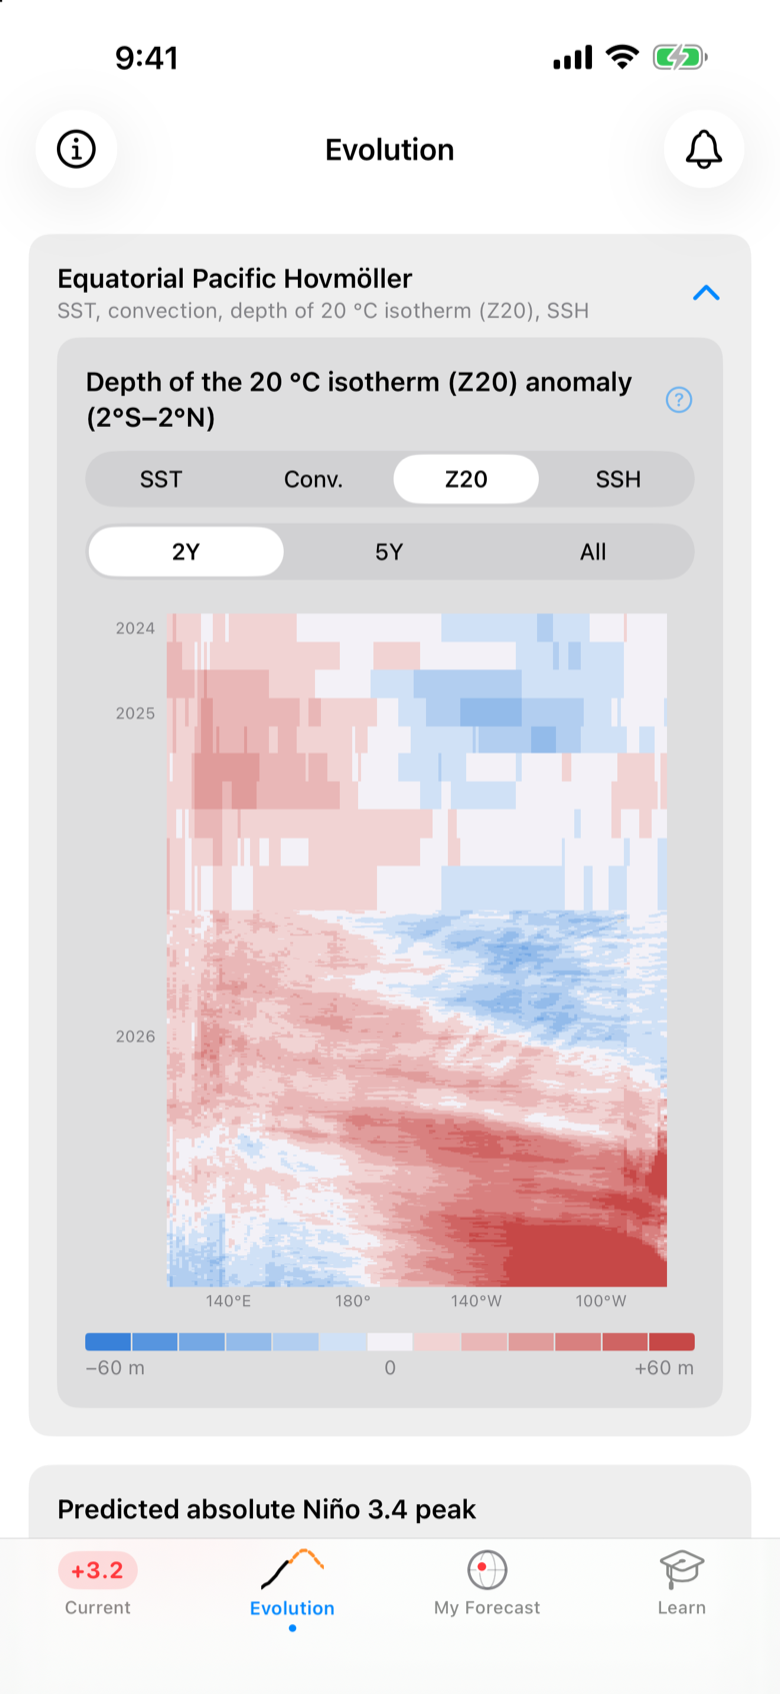
The equatorial Hovmöller (SST, convection, thermocline depth and sea level), the subsurface temperature section, the ENSO Longitude Index with its forecast, and a sea surface height map.
13 forecast models
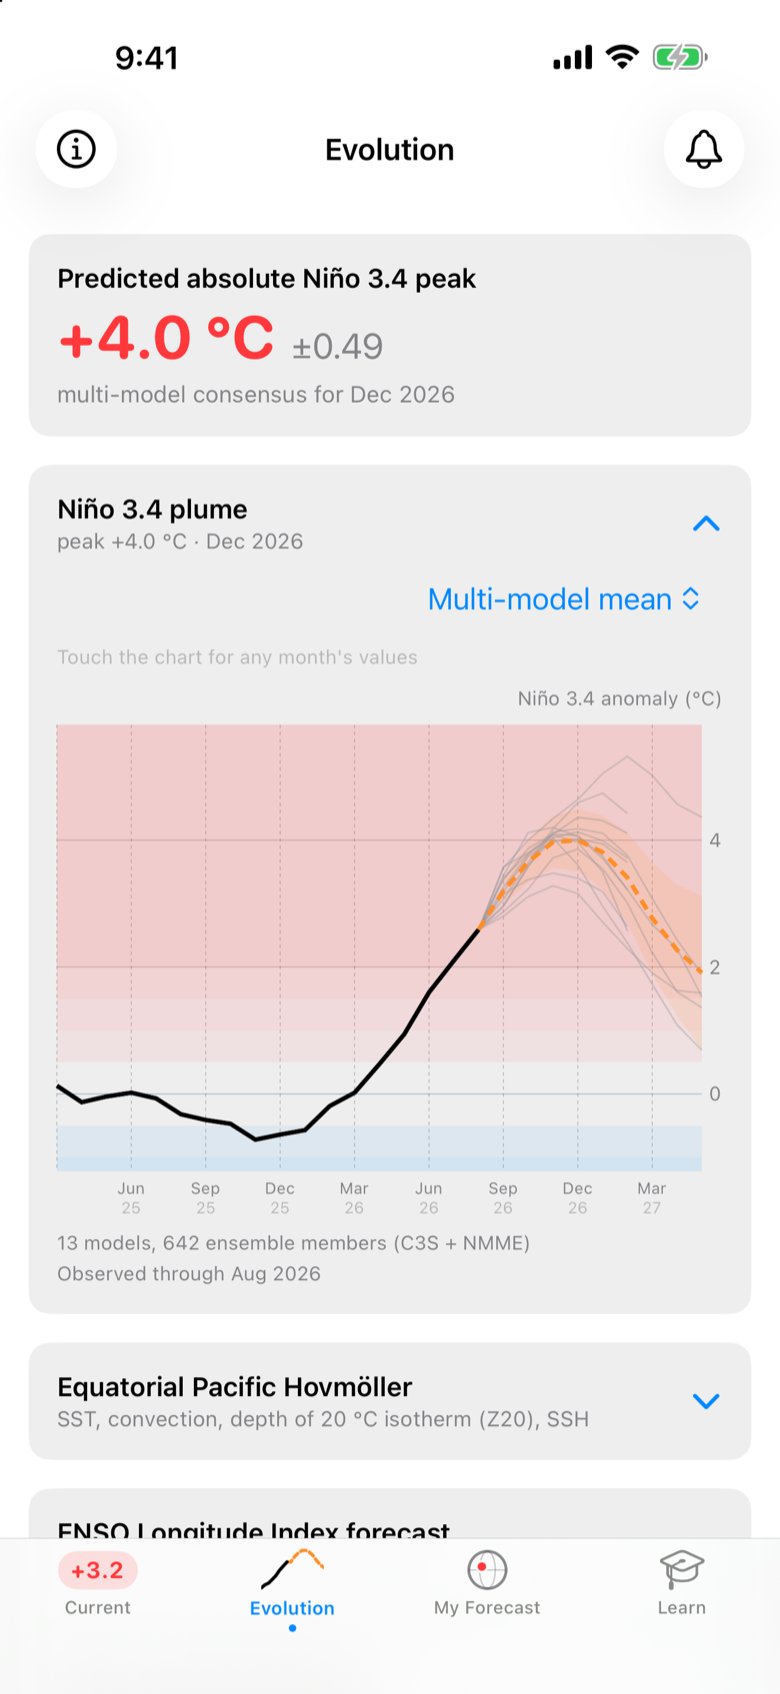
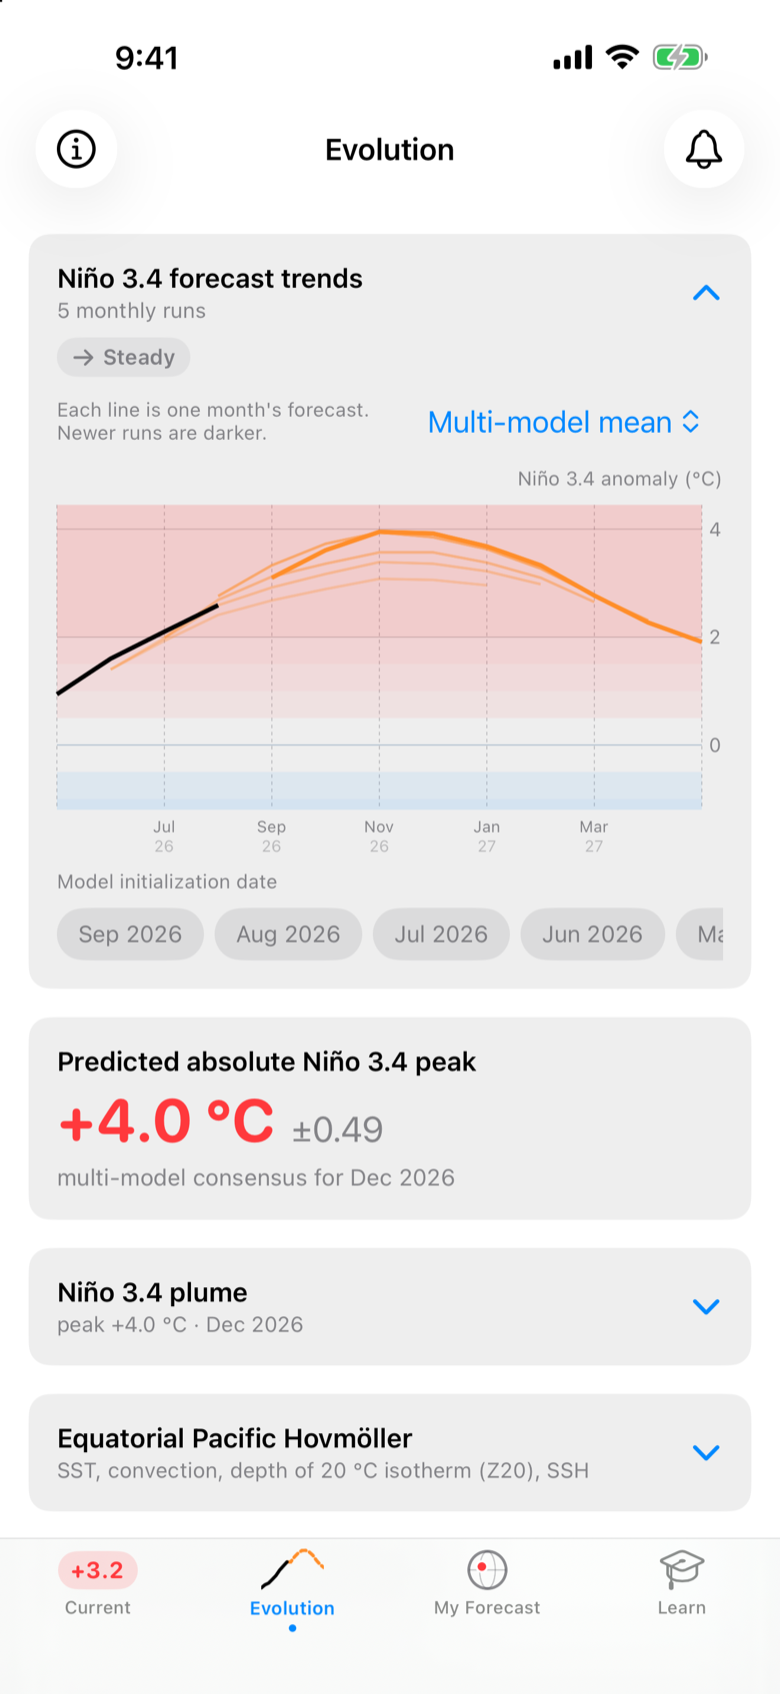
The full multi-model plume from NOAA, NASA, ECMWF, the Met Office and more, the multi-model mean that decades of verification say to trust, and trends as each month's runs come in.
My Forecast
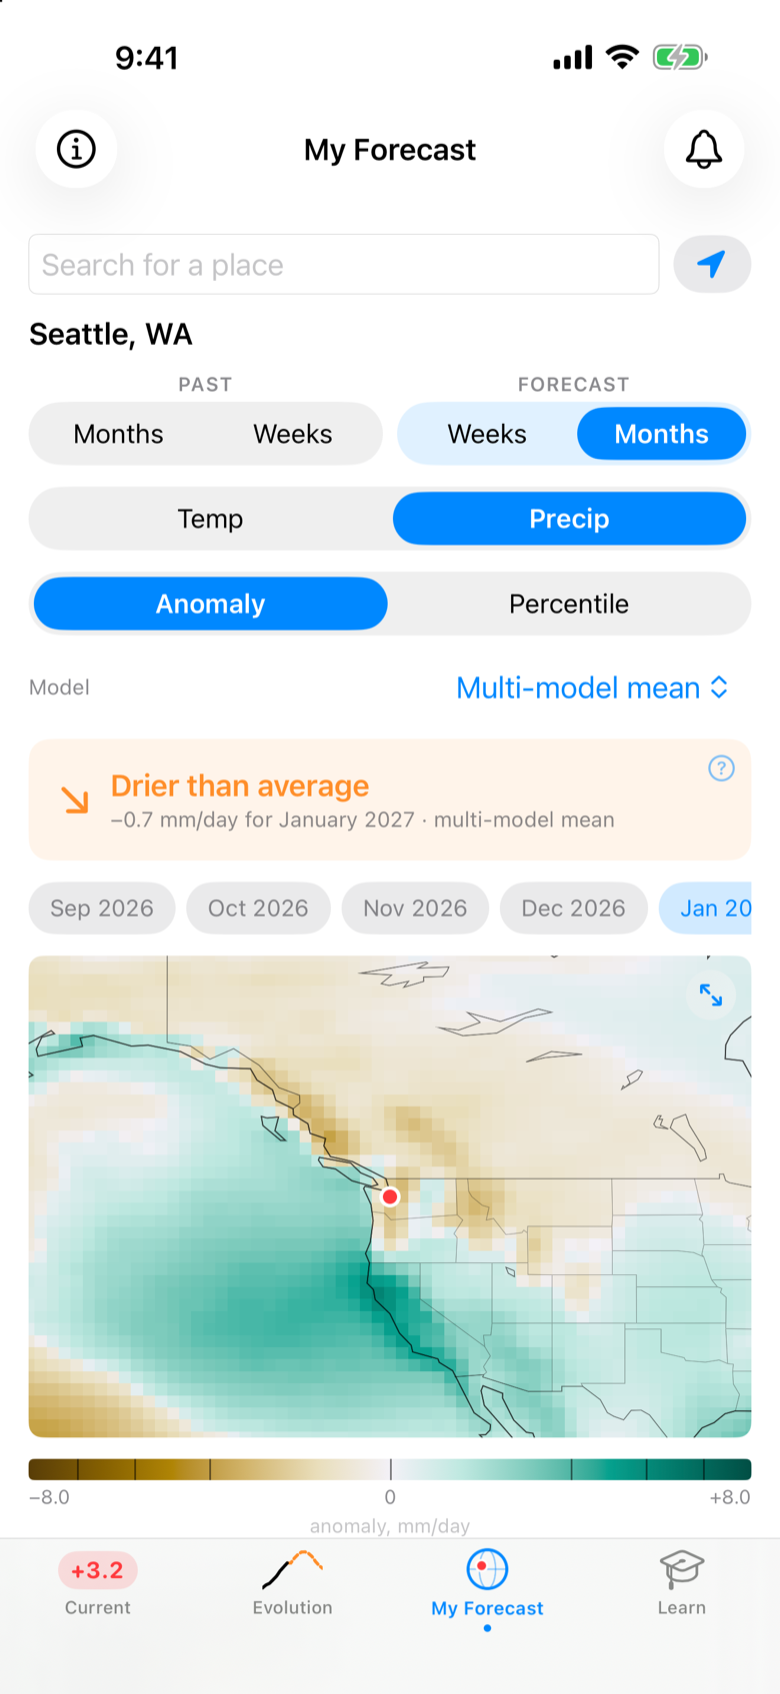
Pick any point on Earth and get its own outlook: a plain verdict, the map framed on your region, and a week-by-week timeline, as anomalies or percentiles, °F or °C.
Built by a PhD atmospheric scientist
Every tile below the surface has a method note and references. The maps are easy to read at a glance, and experts can open individual models and draw their own conclusions.
Alerts that matter
A push when the official status changes, a new ONI posts, a new forecast arrives, or the ocean below the surface changes phase. A few a month; silence otherwise.
75 years of history
Every El Niño and La Niña since 1950 in RONI or ONI (MEI.v2 since 1979), plus five short Learn chapters on how ENSO actually works.